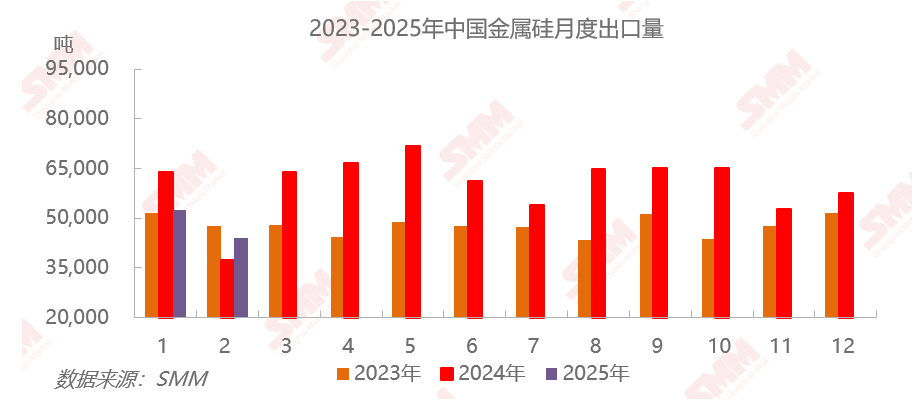
SMM March 26: According to customs data, exports: silicon metal exports in January 2025 were 52,500 mt, down 9% MoM and down 18% YoY. February silicon metal exports were 44,200 mt, down 16% MoM and up 18% YoY. Cumulative silicon metal exports from January to February 2025 were 96,700 mt, down 5% YoY. Imports: China's silicon metal imports in January 2025 were 1,500 mt, down 10% MoM and up 17% YoY. February imports were 1,600 mt, up 11% MoM and down 57% YoY. Cumulative imports from January to February 2025 were 3,100 mt, down 38% YoY.
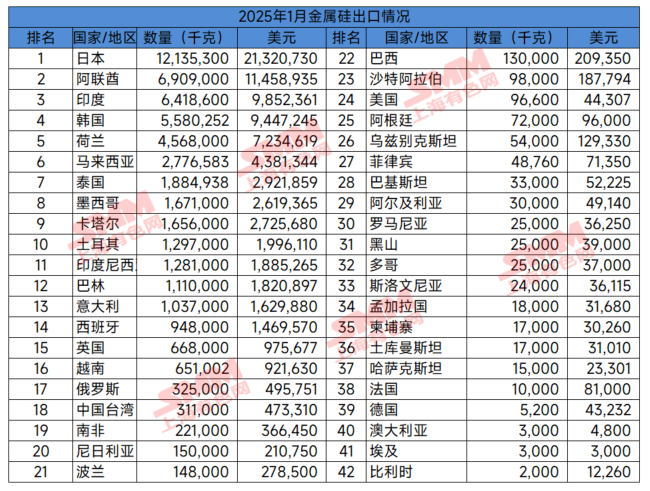
In January, exports: a total of 42 countries or regions were exported to, with the top 10 countries accounting for 44,900 mt (85.5%) of exports. The top 5 export countries accounted for 35,600 mt (67.8%), ranked as Japan (12,100 mt), UAE (6,900 mt), India (6,400 mt), South Korea (5,600 mt), and the Netherlands (4,600 mt). Imports: a total of 9 countries or regions were imported from, mainly France (900 mt) and South Africa (500 mt).
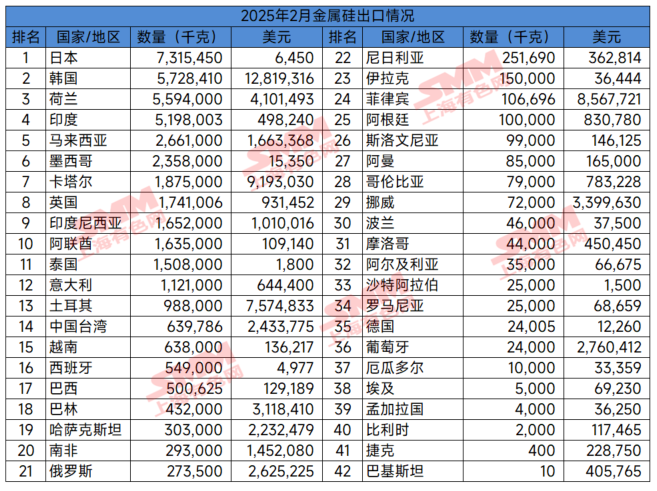
In February, exports: a total of 42 countries or regions were exported to, with the top 10 countries accounting for 35,800 mt (80.9%) of exports. The top 5 export countries accounted for 26,500 mt (60%), ranked as Japan (7,300 mt), South Korea (5,700 mt), the Netherlands (5,600 mt), India (5,200 mt), and Malaysia (2,700 mt). Imports: a total of 2 countries were imported from, France (1,100 mt) and Spain (500 mt).
In February, actual exports decreased MoM due to the impact of the Chinese New Year holiday. In March, export business recovered as market transactions resumed. Affected by the continuous decline in domestic silicon metal prices, some overseas users delayed their purchase orders.
For more detailed market information and dynamics, or other information needs, please call 021-51666820.
![Before the holiday, the black chain is unlikely to see a trend-driven market [SMM Steel Industry Chain Weekly Report].](https://imgqn.smm.cn/usercenter/zUFfM20251217171748.jpg)
![[SMM Chromium Daily Review] Inquiries and Transactions Weakened, Chromium Market Showed Mediocre Performance Before the Holiday](https://imgqn.smm.cn/usercenter/ENDOs20251217171718.jpg)